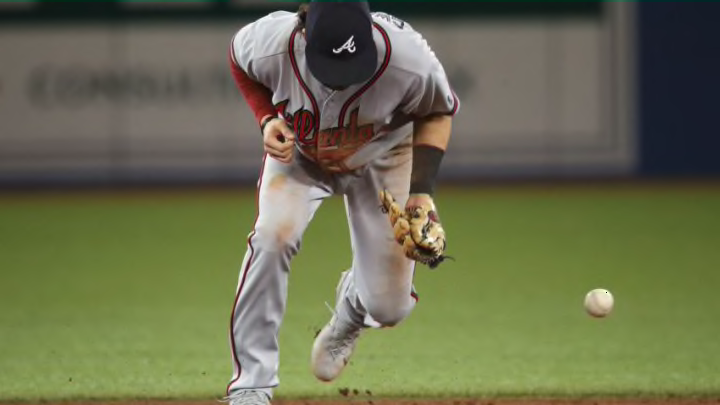
Atlanta Braves and the case for better defense

Alex Anthopoulos is looking for better defense out of his new team in 2018. So how bad is it now?
The Atlanta Braves are looking to upgrade their pitching… and one way to do so has nothing to do with whoever is on the mound. That’s the word from new GM Anthopoulos, who has made his statement about the Braves’ still unachieved off-season priorities.
But let’s see if that case can be made…
Unearned Runs
The metrics are imperfect by themselves, but they do tend to add up. First off, here’s an easy list to understand: unearned runs allowed.
- Cleveland – 35 (best in majors)
- Rockies – 36
- Dodgers – 37
- Angels – 37
- Astros – 38
- Orioles – 45
- Nationals – 48
Notice anything about those clubs? Most of them were playoff teams in 2017… or nearly so. That’s not a universal truism, but it is an interesting correlation. It’s also notable that the Angels have been busily improving themselves on defense even more over the past week.
Now here’s the worst from that list:
- Athletics – 83
- Diamondbacks – 71
- Padres – 69
- Rangers – 67
- Braves, White Sox – 65 (tie)
- Mets, Blue Jays, Rays – 64 (tie)
Yes: as bad as the Mets were (so we thought), the Braves were worse – a tie for 26th in baseball.
Even at that – nearly twice the allowed extra runs as the best team – at least we weren’t “Oakland bad”. That team allowed an unearned run during literally every other game.
Now part of the flaw in this stat, of course, is that better pitching can work around errors and prevent extra unearned runs from scoring, too. On top of the excessive unearned runs, the Braves also allowed the 24th most runs in baseball.
Fielding Metrics
I won’t belabor this point, but here are a few team fielding items of note:
- Team errors: Braves 19th overall (97). Best was Miami (73) and Cleveland (76). Wanna know how the Fins managed to win better in 2017? It wasn’t their pitching (26th worst ERA in baseball). It was their hitting and defense.
- Team DRS (Defensive Runs Saved): Braves 26th with -43 (tied with Giants). Best was Tampa Bay at an incredible +50… despite 100 errors.
- Team RZR (Percentage of balls in a fielder’s zone turned into outs): Braves 23rd (80.0%). The Indians (#1) were 3.4% better. Doesn’t sound like a lot, but note that these are the plays that should be made.
- Team OOZ (Number of plays made on balls out of a fielder’s normal zone): Braves 15th (536). The most? The White Sox had 623; Rays were next at 615. Oddly, the Indians had the fewest (again, these stats do have their shortcomings along with seemingly conflicting info at times).
- Team UZR/150 (Ultimate Zone Rating – scaled to average chances per year): Cincy was #1 at +4.8. The Braves were 19th at -0.4. The worst? Oakland again at -7.7.
The single biggest takeaway I’m seeing from these stats is that while maybe Oakland GM Billy Beane is a stat head about his offense and pitching, he seems to be completely ignoring the fielding numbers – his club has been just awful defenders.
But that said, the Braves truly haven’t been a lot better.
Sum of the Parts
More from Tomahawk Take
- Braves News: Braves re-sign Stephens, Will Atlanta extend Max Fried?, more
- Notable Atlanta Braves Reunions Since 2003: Pitcher Edition
- Braves News: Braves re-sign Jackson Stephens
- Braves News: Braves prospect rankings, Correa deal with Mets at risk, more
- Why the Atlanta Braves won’t extend Max Fried
So when all of those stats are compiled (plus a couple more) and a composite rank is calculated (I haz spreadsheets!), then here’s my conclusion:
- Best defensive club in 2017: Cincinnati (score of 51)
- 2nd best: Dodgers (score of 59)
- Worst: Oakland (177)
- Next-to-worst: Arizona (153)
- Braves: 24th-25th (141 pts, tied with Houston)
One thing you might pick up on – I left out the catcher-specific stats… things like wild pitches and passed balls allowed, throwing errors from the plate, steals vs. caught stealing.
There’s two reasons for omitting that data: (1) it wasn’t obvious how to scale that into the rest of the team numbers, and (2) we’ve got the catchers we’ve got… for 2018, Anthopoulos won’t be upgrading the Braves’ defense at that position regardless of what he thinks of Suzuki and Flowers.
Obviously, AA is looking at just a few positions to upgrade this off-season, but oddly enough, third base was actually a defensive plus for Atlanta in 2017: the composite defensive score for that position was +6.6… good for 7th overall!
Other positions… could be better:
- LF – 27th (clearly the most visible need)
- CF – only 12th for reasons unclear
- RF – 19th
- SS – 18th
- 1B – 13th… but nothing’s changing there, either (except hopefully a full year of Freeman)
- 2B – 6th
- for the record, the catchers graded out at 23rd
So there’s clearly work to do – but defense can only support the pitching just so much.
Hopefully, the kids going to the mound will have their own determination to help their defenders – by inducing weak contact.