Atlanta Braves have dominance among them

We have often speculated about what a healthy Freddie Freeman could do. Don’t miss this… it’s finally happening.
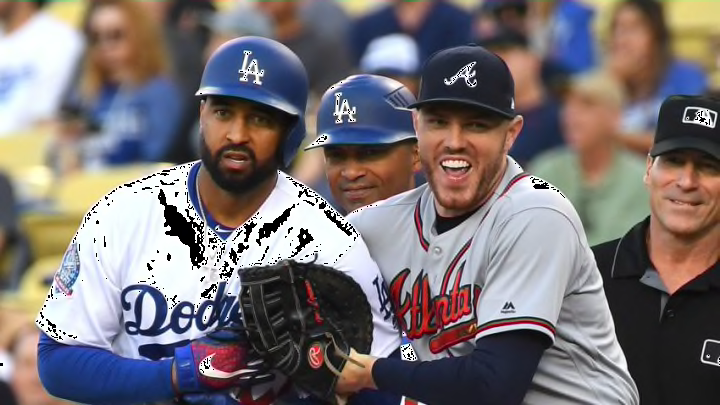
The Atlanta Braves truly have a dominating offensive player leading their efforts thus far in 2018 in the person of first baseman Freddie Freeman. Here we are at 65 games into the season… roughly 40% done… and the numbers are almost eye-popping… whether via conventional or unconventional means.
We are now in the Era of The Shift – a time at which analytics are advising (at the very least) and often directing how lineups are constructed, how pitchers mix their arsenal, how hitters react, and how batters are defended.
Shifts are being used because they are effective. Data from MLB in 2017 suggested that Brandon Belt, for instance, lost half his hits on ground balls due to the use of infield shifts against him.
That’s not a problem for Freeman:
- 2018 Batting average, vs. no shift: .350
- 2018 Batting average, vs. “traditional” shift: .378
- 2018 Batting average, vs. “non-traditional” shift: .750
- You like wRC+ (weighted/scaled Runs-created) numbers? Okay… in the same order, those numbers are 112, 135, and 393.
Yeah – he’s actually not just beating the shift… he’s making it better for the defense to play him straight up (or maybe just walk him).
Historic Proportions
By fangraphs’ Wins Above Replacement, 2016 was Freeman’s best year to date before now, recording a 6.2 on that scale. Before that, he’d “only” managed to reach 5.0 in 2013.
Freddie might have a 5 on the board before the All-Star break. He’s on pace for an 8.75.
The last Braves player to reach that level of production was – no, it wasn’t Chipper Jones – Darrell Evans, who posted an 9.7 in 1973… 45 seasons ago, and the highest for any Brave ever.
Something in the 8.7/8.8 range would rank in the neighborhood of 4th-6th all time for this franchise, battling with Tommy Holmes (1945) and Eddie Mathews (1953). 2nd place is held by Rogers Hornsby (9.0, 1928) and Hank Aaron (8.9, 1961).
Chipper’s best ever? A 7.3 in 1999. In those more modern times, Andruw Jones bested that with a 7.9 in 2005 and J.D. Drew posted 8.6 in 2004.
Are you getting the picture on how rare this is?
You could even argue that Freeman is doing a lot of this without a lot of ‘protection’ in the lineup. Sure – Nick Markakis is having himself a turnback-the-clock season, but his 2.1 fWAR (while very good) isn’t enough to make pitchers think they need to throw him more strikes.
Beating Everybody
So how is Freeman doing vs. his peers? Very well, thank you:
- Freeman: 3.2 fWAR
- Brandon Belt: 2.5
- Max Muncy: 2.0 (seems like 1.5 of that came this last weekend)
- Joey Votto: 2.0
- Paul Goldschmidt: 1.9
- Mitch Moreland: 1.6 (yeah, I’ve included the American League in this list, too)
No other first baseman has exceeded 1.4 as of Sunday’s game results. Freeman is not only beating them all, but he’s been at least 50% more productive than all but 3 of his fellow first basemen from either league.
More from Tomahawk Take
- Braves News: Braves re-sign Stephens, Will Atlanta extend Max Fried?, more
- Notable Atlanta Braves Reunions Since 2003: Pitcher Edition
- Braves News: Braves re-sign Jackson Stephens
- Braves News: Braves prospect rankings, Correa deal with Mets at risk, more
- Why the Atlanta Braves won’t extend Max Fried
Only Muncy (171) exceeds Freeman’s 167 wRC+ number (Freeman with 50% more games played).
Freeman is in the top ten for strikeout rates (least).
He’s 4th in homers in MLB among those regularly playing 1B
Oh, and that puts Freddie #1 overall in the National League in those last 2 categories… and percentage points behind Scooter Gennett in the NL batting race.
So why is Freeman leading all vote-getters for the All-Star game as of yesterday’s first update?
Because he’s earned every vote. Watch him – you might not see numbers like this again for another generation.
Or maybe he’ll just reload and do it all again in 2019.