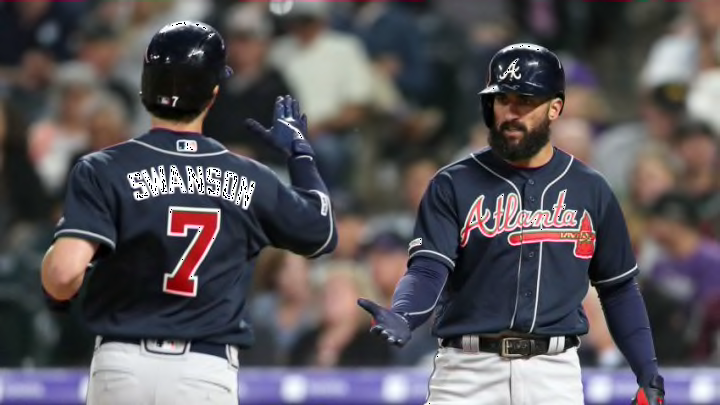
Atlanta Braves twenty-four games in – who’s hot who’s not
By Fred Owens

The Atlanta Braves are a month into the season sporting a 12-12 record. This seems like a good time to see who is hitting the ball well and who hasn’t done so well.
Watching the Atlanta Braves every night tends to make us on each at bat as if it mirrors the player’s season; it doesn’t. Reminding ourselves that pitchers win the battle more than 70% of the time helps a little, but the numbers present a better picture.
Today I’ll look back at the first 24 games to see who performed well at the plate and who didn’t do quite so well. I’ll follow that will a look at the past week to see who had a good week. The plan now is to provide this update once a week, but plans do change.
Along with the usual stat lines, I’ll include data from StatCast including some of their X-stats. X-stats are not predictive, they look at batted ball events (BBE) – essentially all balls in play – and using their historical records to see the outcome of a ball hit at a specific speed and launch angle to a specific quadrant of the field. Think of it as a more granular measure of BAbip (batting average for balls in play).
For example, last year Freddie Freeman hit .309 with a .505 slugging percentage and a wOBA of .378. StatCast calculated that he should have had a .295 average. .533 slugging and a .386 wOBA.
He might have managed a couple of lucky hits but he was robbed of some production that balls like the ones he hit produced in the past.
I’ll also add Batting Average on CONtact – BACON (no eggs; sorry). Developed by Colin Wyers, BACON is essentially BAbip plus home runs. Bryan Grosnick explained the what and why a couple of years back
"BABIP . . .helps illustrate a pitcher’s reliance on defense/luck . . . BACON. . . is more useful from the hitter’s perspective, as it includes home runs, which BABIP ignores. The home run is useful contact – the most useful contact, in fact – and. . .(it) is a results-oriented way to look at this ability, whereas things (look at) the same skill from a process-based viewpoint . . ."
Like all statistics, sample size matters so take them all with a grain of salt and two aspirin. I have to create a cutoff so, for the purposes of this post, a player has to have an OPS of at least .800. Now, let’s look at some numbers.