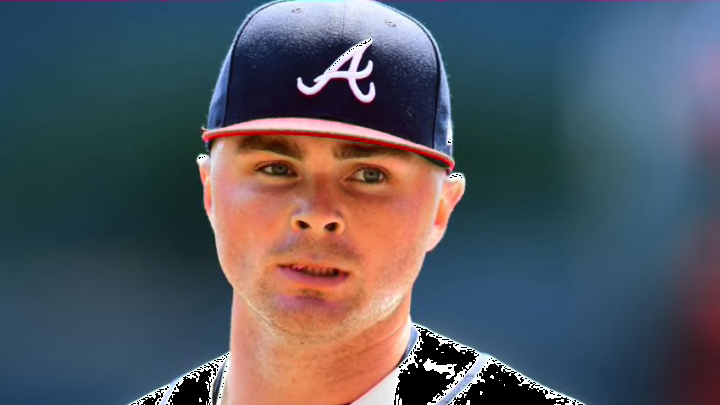
The Atlanta Braves’ Sean Newcomb and His New Role
By Clint Manry

The Exercise
The first thing Clemens wanted to look at was pitcher fatigue, in terms of a pitcher’s fastball velocity at the beginning of his start compared to the end.
Here’s a excerpt from the piece:
"The first place my mind goes is fatigue. When you watch a great starter pitch, it often seems like they’re getting stronger as the game goes on, maintaining or even increasing velocity and mixing in new pitches. How many times have you seen Justin Verlander or Jacob deGrom spike a 98 on the radar gun in an important spot in the seventh inning?"
Here’s the list Clemens created, listed from largest velocity decline to smallest (all rates as of May 23):
- Aaron Nola: -1.5 MPH
- Pablo Lopez: -1.5 MPH
- Sean Newcomb: -1.4 MPH <–
- Luis Castillo: -1.3 MPH
- Nathan Eovaldi: -1.3 MPH
- Tyson Ross: -1.3 MPH
- Nick Pivetta: -1.2 MPH
- Gregory Soto: -1.2 MPH
- Domingo German: -1.1 MPH
- Brad Keller: -1.1 MPH
- Jonathan Loaisiga: -1.0 MPH
- Jon Lester: -1.0 MPH
In regards to Newcomb, Clemens found that the Braves starter had an ‘early’ velo (first 20 pitches) of 93.5 MPH and a ‘late’ velo (pitch 51 to 70) of 92.1 MPH, equaling a difference – a drop – of 1.4 MPH.
Newcomb’s drop in velocity throughout his starts ranked as the third highest among the 12-most impacted starting pitchers that Clemens used in the exercise.
Now, there are some starters that made his list that are far from being threatened, in terms of being pushed into a reliever role. For example: Jon Lester ranks last on the list with a minus-1 MPH decrease in velocity from ‘early’ to ‘late’ measurements.
Also, Aaron Nola — who’s ranked as the biggest velocity decliner on the list — shouldn’t be too worried about his future as a starter, as he’s been a key figure in the Phillies’ rotation with a 3.10 ERA in 438 innings-pitched since 2017.
The experiment isn’t supposed to be fool proof.
That said, there are some others beside Newcomb that really do make sense: Nick Pivetta makes the list as the 7th largest velocity decliner, dropping 1.2 MPH on average throughout his starts.
Like Newcomb, Pivetta was optioned to Triple-A this season, after making his first four starts for the Phillies. His last big league start for Philadelphia was back on April 16, when he gave up two home runs and three total runs in five innings.
After that final outing, over a month ago, Pivetta’s line looked like this as a starting pitcher this season (as of May 23):
18.1 IP, 31 H, 17 ER, 5 HR, 8 BB, 16 K
Wow, that’s an 8.35 ERA and a horrible .383 batting average against for Pivetta in those starts.
So you see, the logic does line up relatively well.
Looking at a few guys on the list:
- Pablo Lopez has struggled a bit thus year, pitching to a 5.06 ERA and surrendering five home runs in his nine starts thus far for the Marlins.
- Tyson Ross, who had a nice three-year stretch from 2013-2015 where he pitched to a 3.07 ERA in 516.2 IP, hasn’t pitched well this season for the Detroit Tigers.
Ross is currently on the 10-day IL with an elbow injury, but he’s made 7 starts thus far and has given up 7 home runs, good for a 6.11 ERA.
- Lastly, Gregory Soto is another Tigers pitcher that’s struggling. The 24-year-old lefty is in his first big league season, but has been terrible in his 10 innings of work (3 starts). Soto has given up 12 earned runs already, good for a 10.80 ERA.
Looking at a pitcher’s velocity and how much it decreases throughout a start isn’t the only way to look at whether or not a role change is in order, but it does seem like Clemens is on to something.