Atlanta Braves 2017 positional reviews: left field

Stability in left field… sounds like a worthy goal, but that has eluded the Braves for quite a while.
I noted earlier in this series that the Atlanta Braves once had a revolving turnstile full of 1st basemen over the past couple of decades – until Freddie Freeman showed up to claim the spot for his own.
Well, left field has been at least as unsettled.
In the past 20 seasons, fangraphs credits forty-three players at the position – with at least 50 plate appearances.
Want to hear some blasts from the past? How about these Braves’ left fielders:
- Eli Marrero
- Willie Harris
- B.J. Surhoff
- Curtis Pride
- Bernard Gilkey
- Greg Norton
- Trent Hubbard
- Danny Bautista
- Pedro Ciriaco
- Daryle Ward
That’s just a sampling, of course… and that 43 doesn’t even include guys like Adonis Garcia and 27 others that didn’t make the chart.
Yes – 70 players have roamed left field for Atlanta since 2008.
Those with the most exposure to that corner of the outfield in those past 20 years are these:
- Chipper Jones (2862 innings)
- Matt Diaz (2459)
- Justin Upton (2159)
- Martin Prado (1863)
Matt Kemp is next on this list at 1317… after just a year-and-a-half with the club. Let’s see how he – and 10 others – stack up against the rest of major league baseball this season.
PREVIOUS REVIEWS
Offensive Side
First off, let’s take the fWAR pulse – just of the Braves. In ranking those last 20 seasons – just for the left field position (and knowing that fangraphs has some flaws in their compilation process), we see the following:
- Best season: 1998 (6.2 fWAR)
- Worst season: 2000 (-2.1)
- 2017: second worst (-1.3)
Moreover, 2015 ranked 18th of 20 and 2016 ranked 16th… the only season of these recent ones to actually have a positive fWAR number (0.4).
So we already know this is bad… and honestly, I didn’t expect it to be that bad, but it is.
- Best average: Marlins .298, Braves 26th (.244)
- Best OBP: Mets (.372). Braves 26th (.304)
- Best Slugging (added since this is a ‘slugging position’ traditionally): Tigers (.536), Braves 23rd (.402)
- Best OPS: Tigers (.836), Braves 28th (.707)
- wRC+: Tigers 135, Braves 27th (82)
- Walk Rate: Mets (11.9%); Braves 20th (7.7%)
- K Rate: Pirates (16.6%), Braves 19th (23.6%)
- Doubles: Astros (85), Braves 14th (47; tie With Colorado)
- Triples: Arizona 14, Braves tied for 10th (!) with 7.
- Homers: Dodgers 81 (combining all players they used in left field), Braves 19th with 31.
- Steals: Angels 68 (same combination issue), Braves 13th.
So this makes the third position we’ve found so far – along with shortstop and third base – in which Atlanta generally lands in the bottom 10 for offense in major league baseball. Not a recipe for success.
Working with gloves of iron
Left Field does tend to be a place where some teams will try to hide a poor defender. Exhibit A on this is Kyle Schwarber with the Cubs. But there are others…
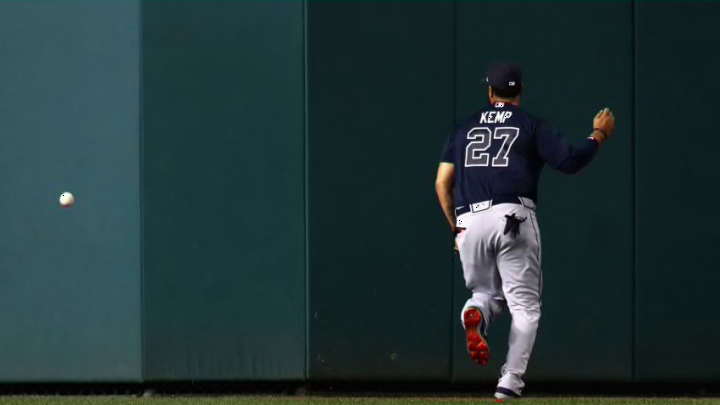
- DRS (Defensive Runs Saved): Of note, Matt Kemp recorded -17 by himself. That’s 17 runs given away. Everybody else registered a combined -5. Clearly, the defenders in left field were giving up runs. Overall: Pirates #1 (+17), Braves dead last with -22. The Cubs were 25th, by the way.
- Plays: Tigers 257; Braves 11th (212)… so left field defense is kind of important.
- RZR (Revised Zone Rating – “the proportion of balls hit into a fielder’s zone that he successfully converted into an out”): Tigers 94.5%; Braves 28th with 85.5%.
- OOZ (Out of Zone plays): Tigers 114; Braves 22th at 86
- Putouts: Again, this number – and those for the rest of the outfield – are more relevant when you have a flyball staff on the hill. The Braves – overall – were in the middle here. Tigers #1 (371), Braves 14th (298).
- Assists: This is relevant: Pirates 15, Braves 5 (29th ranked).
- Errors: Rays 1; Braves tied for 13th with 5.
More from Tomahawk Take
- Show the bullpen some love
- Braves News: Atlanta’s left field situation, Dansby negotiations, more
- Alex Anthopoulos discusses the Atlanta Braves payroll, rotation, Grissom, Swanson, Acuña, and more
- Braves News: Braves 2023 rotation speculation, Correa deal on hold, more
- Atlanta Braves: Current Left Field Mix
The Skinny
Okay, so if you want to make a case for trading Matt Kemp, this is probably it… if there is, in fact, a DH role for him and if teams look at his past more than his current numbers.
Failing that, if you want to make a case for totally buying out his contract (approximately $40 million), then there’s probably a lot to be said for the improvement you’d see on both sides of the ball by simply adding Ronald Acuna and subtracting Kemp (regardless of who ends up in what exact OF positions).
Is that upgrade worth $40 million? Such a free agent signing would cost at least that much. Hey – analytics can tell you how your money needs to be spent, too.
Even if Acuna were to struggle hitting in the majors (and it’s certainly possible), just turning that -17 DRS into a positive number would be significant.
Next: Micah treated like gold by Reds
Regardless of how it’s done, though, the Atlanta Braves’ left field position definitely needs an upgrade.